Note
Go to the end to download the full example code.
GMM Flow
Illustration of the flow of a Gaussian Mixture with respect to its GMM-OT distance with respect to a fixed GMM.
# Author: Eloi Tanguy <eloi.tanguy@u-paris>
#         Remi Flamary <remi.flamary@polytehnique.edu>
#         Julie Delon <julie.delon@math.cnrs.fr>
#
# License: MIT License

# sphinx_gallery_thumbnail_number = 4

import numpy as np
import matplotlib.pylab as pl
from matplotlib import colormaps as cm
import ot
import ot.plot
from ot.utils import proj_SDP, proj_simplex
from ot.gmm import gmm_ot_loss
import torch
from torch.optim import Adam
from matplotlib.patches import Ellipse
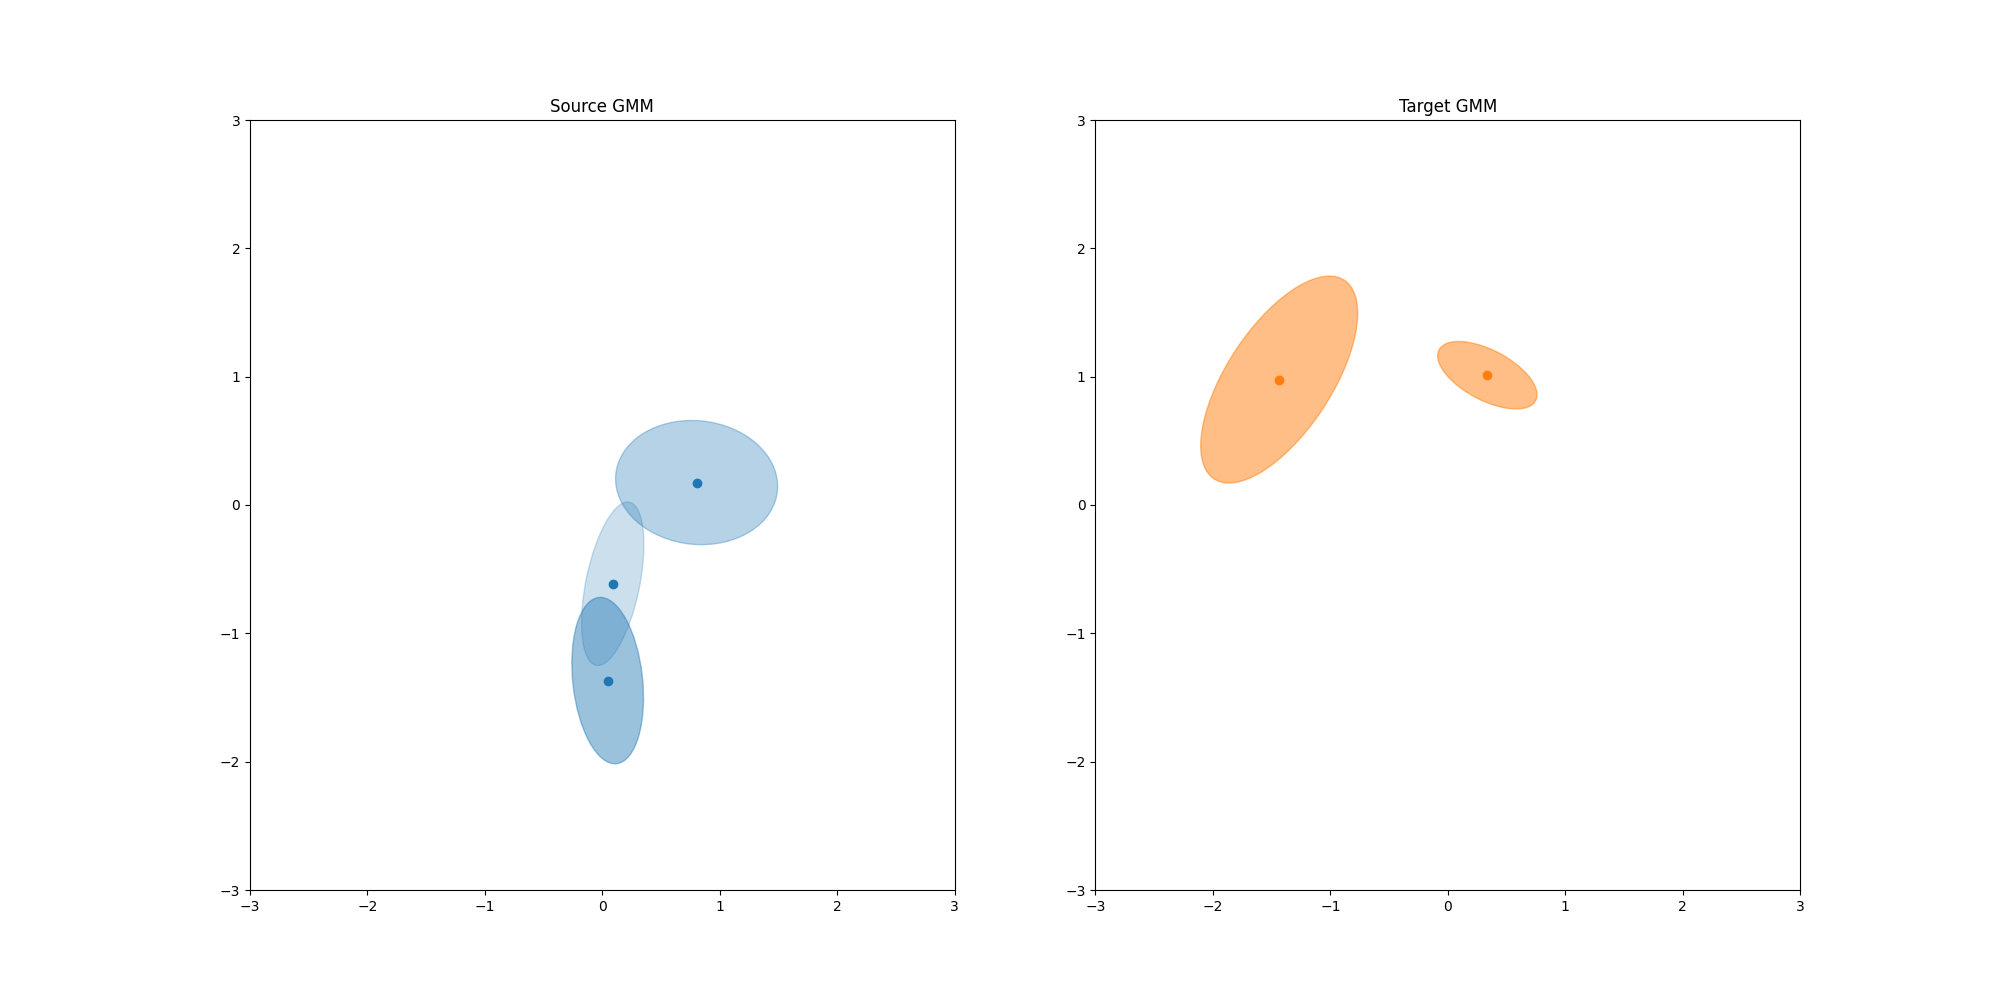
Generate data and plot it
torch.manual_seed(3)
ks = 3
kt = 2
d = 2
eps = 0.1
m_s = torch.randn(ks, d)
m_s.requires_grad_()
m_t = torch.randn(kt, d)
C_s = torch.randn(ks, d, d)
C_s = torch.matmul(C_s, torch.transpose(C_s, 2, 1))
C_s += eps * torch.eye(d)[None, :, :] * torch.ones(ks, 1, 1)
C_s.requires_grad_()
C_t = torch.randn(kt, d, d)
C_t = torch.matmul(C_t, torch.transpose(C_t, 2, 1))
C_t += eps * torch.eye(d)[None, :, :] * torch.ones(kt, 1, 1)
w_s = torch.randn(ks)
w_s = proj_simplex(w_s)
w_s.requires_grad_()
w_t = torch.tensor(ot.unif(kt))


def draw_cov(mu, C, color=None, label=None, nstd=1, alpha=0.5):
    def eigsorted(cov):
        if torch.is_tensor(cov):
            cov = cov.detach().numpy()
        vals, vecs = np.linalg.eigh(cov)
        order = vals.argsort()[::-1].copy()
        return vals[order], vecs[:, order]

    vals, vecs = eigsorted(C)
    theta = np.degrees(np.arctan2(*vecs[:, 0][::-1]))
    w, h = 2 * nstd * np.sqrt(vals)
    ell = Ellipse(
        xy=(mu[0], mu[1]),
        width=w,
        height=h,
        alpha=alpha,
        angle=theta,
        facecolor=color,
        edgecolor=color,
        label=label,
        fill=True,
    )
    pl.gca().add_artist(ell)


def draw_gmm(ms, Cs, ws, color=None, nstd=0.5, alpha=1):
    for k in range(ms.shape[0]):
        draw_cov(ms[k], Cs[k], color, None, nstd, alpha * ws[k])


axis = [-3, 3, -3, 3]
pl.figure(1, (20, 10))
pl.clf()

pl.subplot(1, 2, 1)
pl.scatter(m_s[:, 0].detach(), m_s[:, 1].detach(), color="C0")
draw_gmm(m_s.detach(), C_s.detach(), torch.softmax(w_s, 0).detach().numpy(), color="C0")
pl.axis(axis)
pl.title("Source GMM")

pl.subplot(1, 2, 2)
pl.scatter(m_t[:, 0].detach(), m_t[:, 1].detach(), color="C1")
draw_gmm(m_t.detach(), C_t.detach(), w_t.numpy(), color="C1")
pl.axis(axis)
pl.title("Target GMM")

Text(0.5, 1.0, 'Target GMM')
Gradient descent loop
n_gd_its = 100
lr = 3e-2
opt = Adam(
    [
        {"params": m_s, "lr": 2 * lr},
        {"params": C_s, "lr": lr},
        {"params": w_s, "lr": lr},
    ]
)
m_list = [m_s.data.numpy().copy()]
C_list = [C_s.data.numpy().copy()]
w_list = [torch.softmax(w_s, 0).data.numpy().copy()]
loss_list = []

for _ in range(n_gd_its):
    opt.zero_grad()
    loss = gmm_ot_loss(m_s, m_t, C_s, C_t, torch.softmax(w_s, 0), w_t)
    loss.backward()
    opt.step()
    with torch.no_grad():
        C_s.data = proj_SDP(C_s.data, vmin=1e-6)
        m_list.append(m_s.data.numpy().copy())
        C_list.append(C_s.data.numpy().copy())
        w_list.append(torch.softmax(w_s, 0).data.numpy().copy())
        loss_list.append(loss.item())

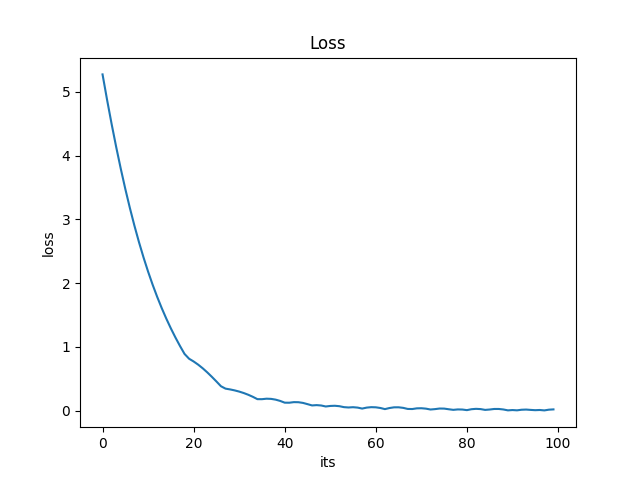
pl.figure(2)
pl.clf()
pl.plot(loss_list)
pl.title("Loss")
pl.xlabel("its")
pl.ylabel("loss")

Text(55.847222222222214, 0.5, 'loss')
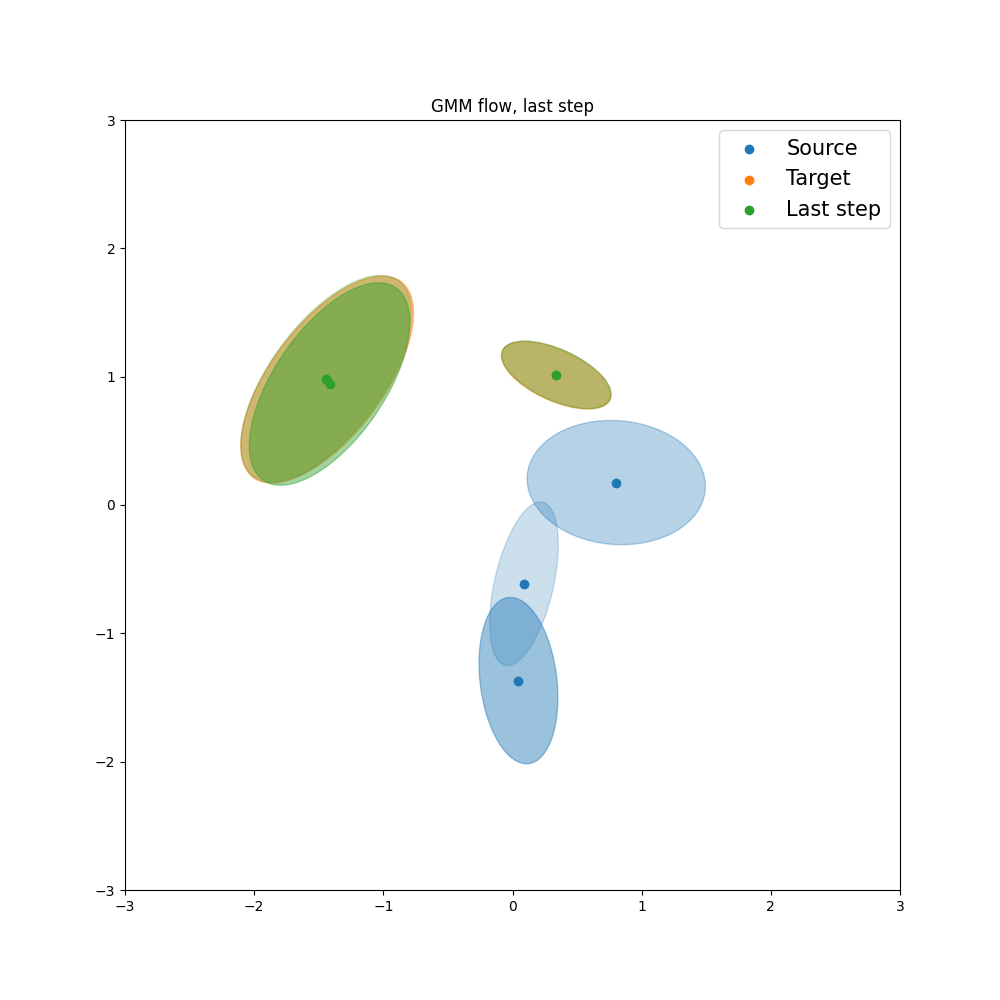
Last step visualisation
axis = [-3, 3, -3, 3]
pl.figure(3, (10, 10))
pl.clf()
pl.title("GMM flow, last step")
pl.scatter(m_list[0][:, 0], m_list[0][:, 1], color="C0", label="Source")
draw_gmm(m_list[0], C_list[0], w_list[0], color="C0")
pl.axis(axis)

pl.scatter(m_t[:, 0].detach(), m_t[:, 1].detach(), color="C1", label="Target")
draw_gmm(m_t.detach(), C_t.detach(), w_t.numpy(), color="C1")
pl.axis(axis)

k = -1
pl.scatter(m_list[k][:, 0], m_list[k][:, 1], color="C2", alpha=1, label="Last step")
draw_gmm(m_list[k], C_list[k], w_list[0], color="C2", alpha=1)

pl.axis(axis)
pl.legend(fontsize=15)

<matplotlib.legend.Legend object at 0x7f58eaf21120>
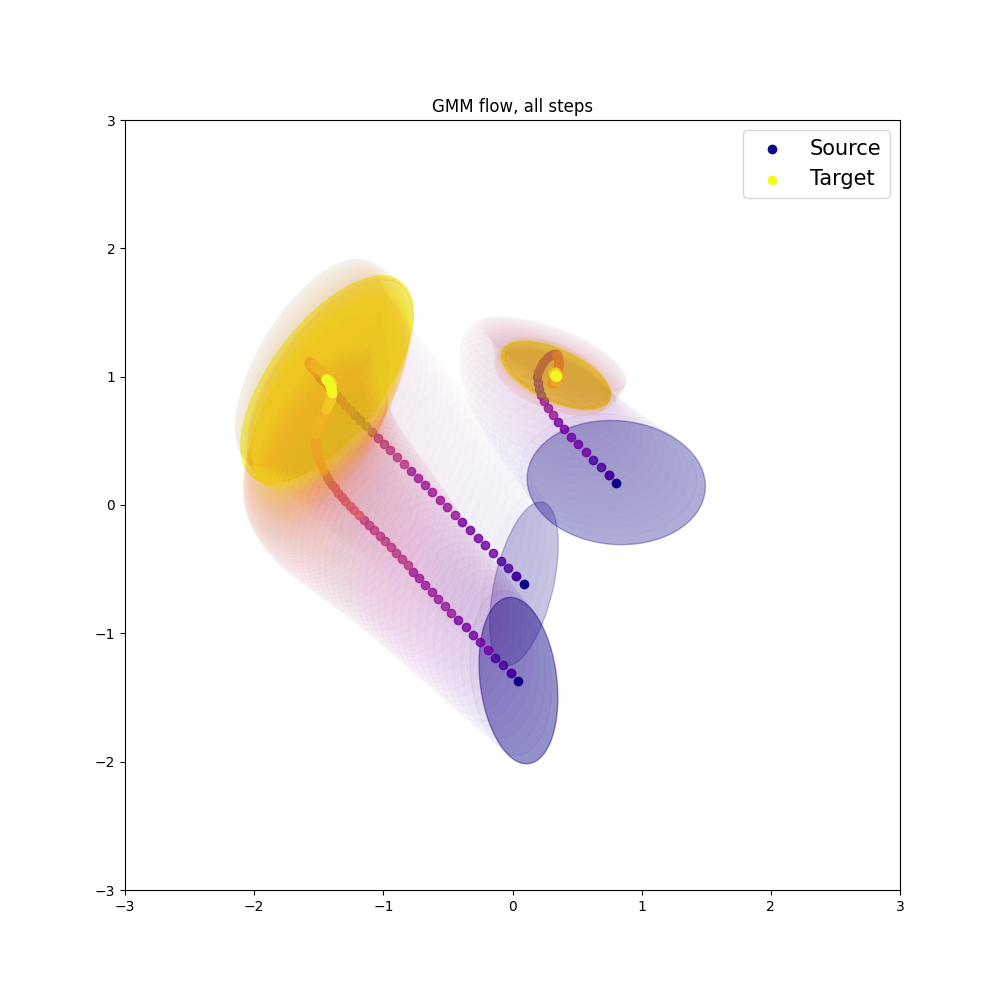
Steps visualisation
def index_to_color(i):
    return int(i**0.5)


n_steps_visu = 100
pl.figure(3, (10, 10))
pl.clf()
pl.title("GMM flow, all steps")

its_to_show = [int(x) for x in np.linspace(1, n_gd_its - 1, n_steps_visu)]
cmp = cm["plasma"].resampled(index_to_color(n_steps_visu))

pl.scatter(
    m_list[0][:, 0], m_list[0][:, 1], color=cmp(index_to_color(0)), label="Source"
)
draw_gmm(m_list[0], C_list[0], w_list[0], color=cmp(index_to_color(0)))

pl.scatter(
    m_t[:, 0].detach(),
    m_t[:, 1].detach(),
    color=cmp(index_to_color(n_steps_visu - 1)),
    label="Target",
)
draw_gmm(
    m_t.detach(), C_t.detach(), w_t.numpy(), color=cmp(index_to_color(n_steps_visu - 1))
)


for k in its_to_show:
    pl.scatter(
        m_list[k][:, 0], m_list[k][:, 1], color=cmp(index_to_color(k)), alpha=0.8
    )
    draw_gmm(m_list[k], C_list[k], w_list[0], color=cmp(index_to_color(k)), alpha=0.04)

pl.axis(axis)
pl.legend(fontsize=15)

<matplotlib.legend.Legend object at 0x7f58eab32530>
Total running time of the script: (0 minutes 1.571 seconds)