Note
Click here to download the full example code
Linear OT mapping estimation
# Author: Remi Flamary <remi.flamary@unice.fr>
#
# License: MIT License

import numpy as np
import pylab as pl
import ot
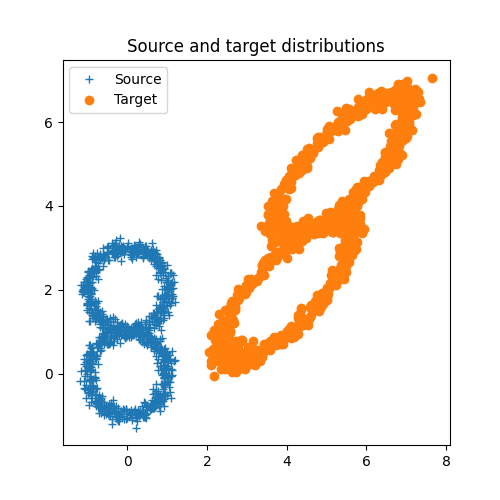
Generate data
n = 1000
d = 2
sigma = .1

# source samples
angles = np.random.rand(n, 1) * 2 * np.pi
xs = np.concatenate((np.sin(angles), np.cos(angles)),
                    axis=1) + sigma * np.random.randn(n, 2)
xs[:n // 2, 1] += 2


# target samples
anglet = np.random.rand(n, 1) * 2 * np.pi
xt = np.concatenate((np.sin(anglet), np.cos(anglet)),
                    axis=1) + sigma * np.random.randn(n, 2)
xt[:n // 2, 1] += 2


A = np.array([[1.5, .7], [.7, 1.5]])
b = np.array([[4, 2]])
xt = xt.dot(A) + b
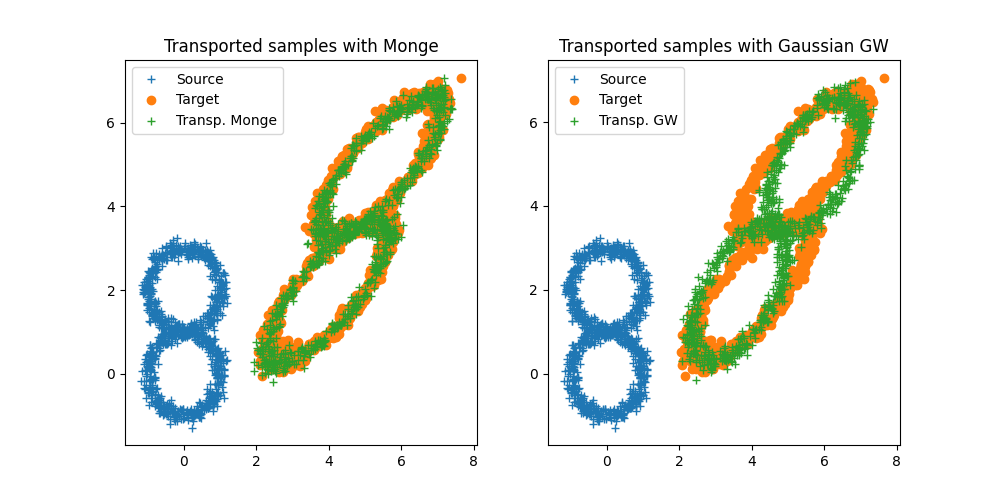
Estimate linear mapping and transport
Plot transported samples
Out:
/home/circleci/project/examples/plot_otda_linear_mapping.py:73: UserWarning: Matplotlib is currently using agg, which is a non-GUI backend, so cannot show the figure.
  pl.show()
Load image data
def im2mat(I):
    """Converts and image to matrix (one pixel per line)"""
    return I.reshape((I.shape[0] * I.shape[1], I.shape[2]))


def mat2im(X, shape):
    """Converts back a matrix to an image"""
    return X.reshape(shape)


def minmax(I):
    return np.clip(I, 0, 1)


# Loading images
I1 = pl.imread('../data/ocean_day.jpg').astype(np.float64) / 256
I2 = pl.imread('../data/ocean_sunset.jpg').astype(np.float64) / 256


X1 = im2mat(I1)
X2 = im2mat(I2)
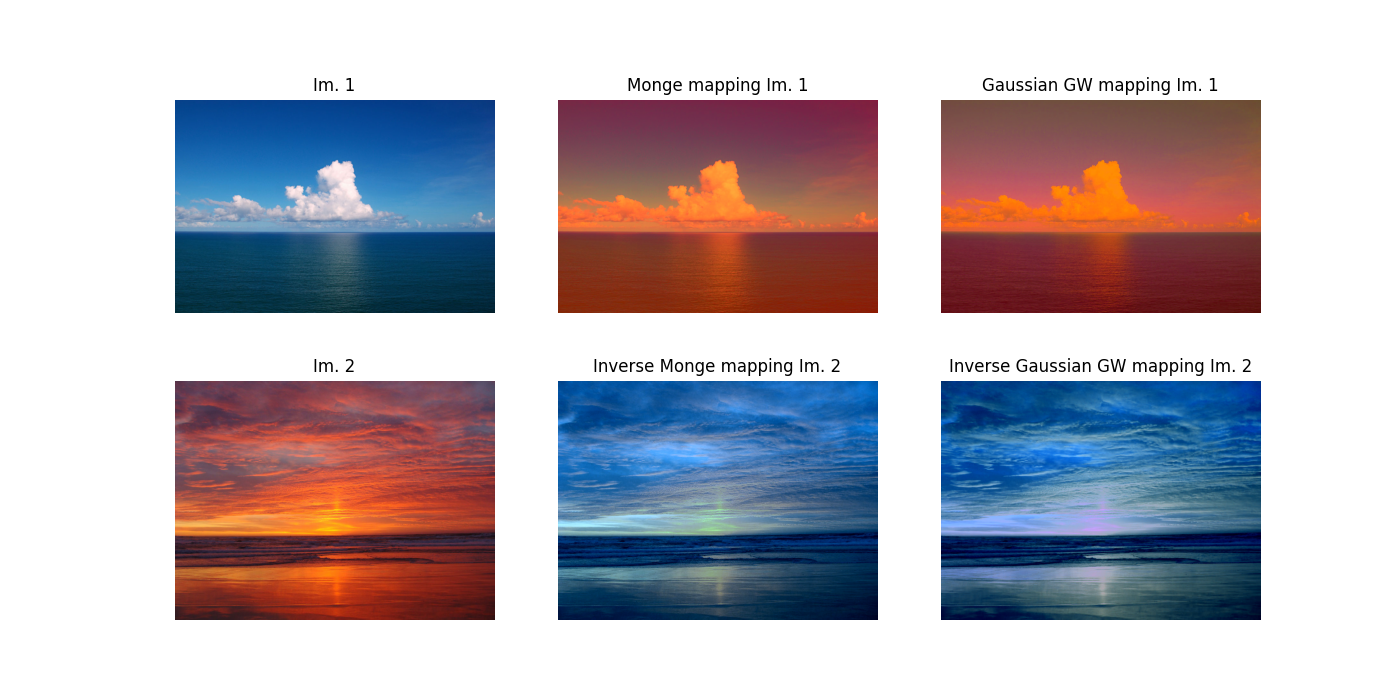
Estimate mapping and adapt
Plot transformed images
pl.figure(2, figsize=(10, 7))

pl.subplot(2, 2, 1)
pl.imshow(I1)
pl.axis('off')
pl.title('Im. 1')

pl.subplot(2, 2, 2)
pl.imshow(I2)
pl.axis('off')
pl.title('Im. 2')

pl.subplot(2, 2, 3)
pl.imshow(I1t)
pl.axis('off')
pl.title('Mapping Im. 1')

pl.subplot(2, 2, 4)
pl.imshow(I2t)
pl.axis('off')
pl.title('Inverse mapping Im. 2')
Out:
Text(0.5, 1.0, 'Inverse mapping Im. 2')
Total running time of the script: ( 0 minutes 3.549 seconds)