Note
Go to the end to download the full example code.
Low rank Gromov-Wasterstein between samples
Note
Example added in release: 0.9.4.
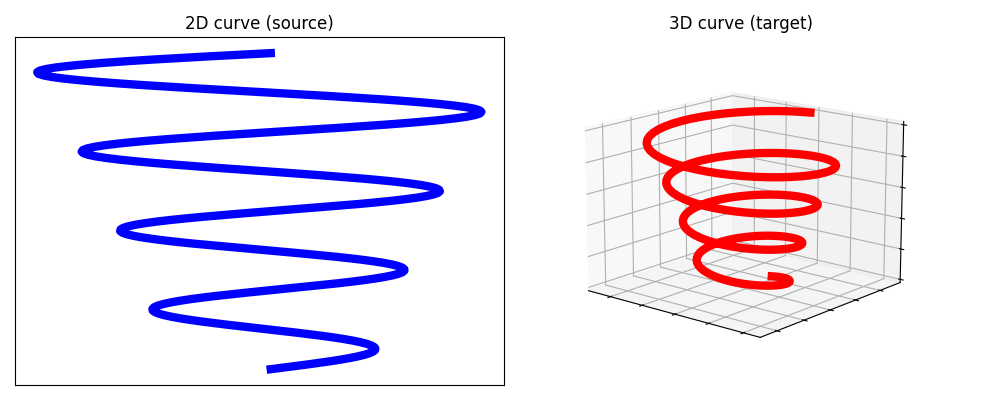
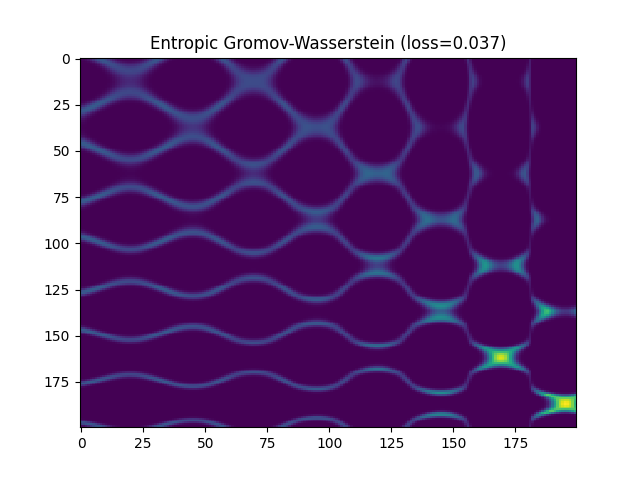
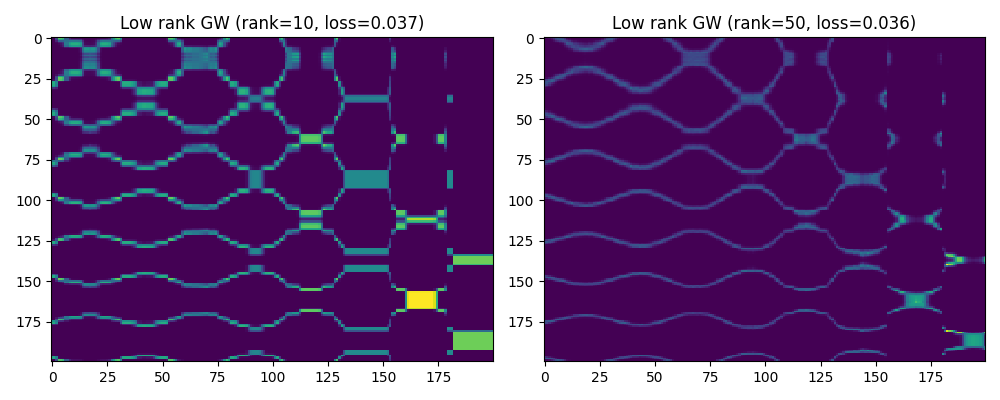
Comparison between entropic Gromov-Wasserstein and Low Rank Gromov Wasserstein [67] on two curves in 2D and 3D, both sampled with 200 points.
The squared Euclidean distance is considered as the ground cost for both samples.
[67] Scetbon, M., Peyré, G. & Cuturi, M. (2022). “Linear-Time GromovWasserstein Distances using Low Rank Couplings and Costs”. In International Conference on Machine Learning (ICML), 2022.
# Author: Laurène David <laurene.david@ip-paris.fr>
#
# License: MIT License
#
# sphinx_gallery_thumbnail_number = 3
import numpy as np
import matplotlib.pylab as pl
import ot.plot
import time
Generate data
n_samples = 200

# Generate 2D and 3D curves
theta = np.linspace(-4 * np.pi, 4 * np.pi, n_samples)
z = np.linspace(1, 2, n_samples)
r = z**2 + 1
x = r * np.sin(theta)
y = r * np.cos(theta)

# Source and target distribution
X = np.concatenate([x.reshape(-1, 1), z.reshape(-1, 1)], axis=1)
Y = np.concatenate([x.reshape(-1, 1), y.reshape(-1, 1), z.reshape(-1, 1)], axis=1)
Plot data
Plot the source and target samples
fig = pl.figure(1, figsize=(10, 4))

ax = fig.add_subplot(121)
ax.plot(X[:, 0], X[:, 1], color="blue", linewidth=6)
ax.tick_params(
    left=False, right=False, labelleft=False, labelbottom=False, bottom=False
)
ax.set_title("2D curve (source)")

ax2 = fig.add_subplot(122, projection="3d")
ax2.plot(Y[:, 0], Y[:, 1], Y[:, 2], c="red", linewidth=6)
ax2.tick_params(
    left=False, right=False, labelleft=False, labelbottom=False, bottom=False
)
ax2.view_init(15, -50)
ax2.set_title("3D curve (target)")

pl.tight_layout()
pl.show()

Entropic Gromov-Wasserstein
# Compute cost matrices
C1 = ot.dist(X, X, metric="sqeuclidean")
C2 = ot.dist(Y, Y, metric="sqeuclidean")

# Scale cost matrices
r1 = C1.max()
r2 = C2.max()

C1 = C1 / r1
C2 = C2 / r2


# Solve entropic gw
reg = 5 * 1e-3

start = time.time()
gw, log = ot.gromov.entropic_gromov_wasserstein(
    C1, C2, tol=1e-3, epsilon=reg, log=True, verbose=False
)

end = time.time()
time_entropic = end - start

entropic_gw_loss = np.round(log["gw_dist"], 3)

# Plot entropic gw
pl.figure(2)
pl.imshow(gw, interpolation="nearest", aspect="auto")
pl.title("Entropic Gromov-Wasserstein (loss={})".format(entropic_gw_loss))
pl.show()

Low rank squared euclidean cost matrices
%%
# Compute the low rank sqeuclidean cost decompositions
A1, A2 = ot.lowrank.compute_lr_sqeuclidean_matrix(X, X, rescale_cost=False)
B1, B2 = ot.lowrank.compute_lr_sqeuclidean_matrix(Y, Y, rescale_cost=False)

# Scale the low rank cost matrices
A1, A2 = A1 / np.sqrt(r1), A2 / np.sqrt(r1)
B1, B2 = B1 / np.sqrt(r2), B2 / np.sqrt(r2)
Low rank Gromov-Wasserstein
%%
# Solve low rank gromov-wasserstein with different ranks
list_rank = [10, 50]
list_P_GW = []
list_loss_GW = []
list_time_GW = []

for rank in list_rank:
    start = time.time()

    Q, R, g, log = ot.lowrank_gromov_wasserstein_samples(
        X,
        Y,
        reg=0,
        rank=rank,
        rescale_cost=False,
        cost_factorized_Xs=(A1, A2),
        cost_factorized_Xt=(B1, B2),
        seed_init=49,
        numItermax=1000,
        log=True,
        stopThr=1e-6,
    )
    end = time.time()

    P = log["lazy_plan"][:]
    loss = log["value"]

    list_P_GW.append(P)
    list_loss_GW.append(np.round(loss, 3))
    list_time_GW.append(end - start)
Plot low rank GW with different ranks
pl.figure(3, figsize=(10, 4))

pl.subplot(1, 2, 1)
pl.imshow(list_P_GW[0], interpolation="nearest", aspect="auto")
pl.title("Low rank GW (rank=10, loss={})".format(list_loss_GW[0]))

pl.subplot(1, 2, 2)
pl.imshow(list_P_GW[1], interpolation="nearest", aspect="auto")
pl.title("Low rank GW (rank=50, loss={})".format(list_loss_GW[1]))

pl.tight_layout()
pl.show()

Compare computation time between entropic GW and low rank GW
print("Entropic GW: {:.2f}s".format(time_entropic))
print("Low rank GW (rank=10): {:.2f}s".format(list_time_GW[0]))
print("Low rank GW (rank=50): {:.2f}s".format(list_time_GW[1]))
Entropic GW: 0.42s
Low rank GW (rank=10): 0.45s
Low rank GW (rank=50): 0.56s
Total running time of the script: (0 minutes 2.193 seconds)