Note
Go to the end to download the full example code.
(Fused) Gromov-Wasserstein Linear Dictionary Learning
Note
Example added in release: 0.8.2.
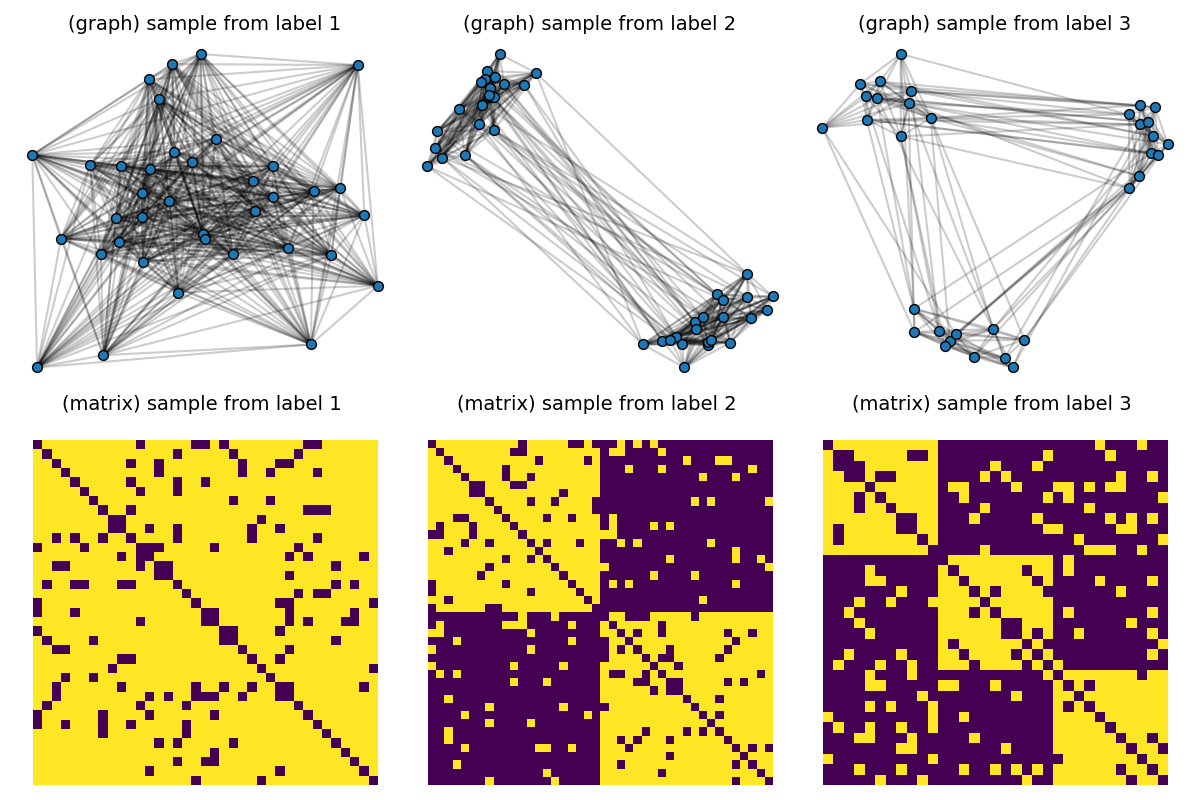
In this example, we illustrate how to learn a Gromov-Wasserstein dictionary on a dataset of structured data such as graphs, denoted \(\{ \mathbf{C_s} \}_{s \in [S]}\) where every nodes have uniform weights. Given a dictionary \(\mathbf{C_{dict}}\) composed of D structures of a fixed size nt, each graph \((\mathbf{C_s}, \mathbf{p_s})\) is modeled as a convex combination \(\mathbf{w_s} \in \Sigma_D\) of these dictionary atoms as \(\sum_d w_{s,d} \mathbf{C_{dict}[d]}\).
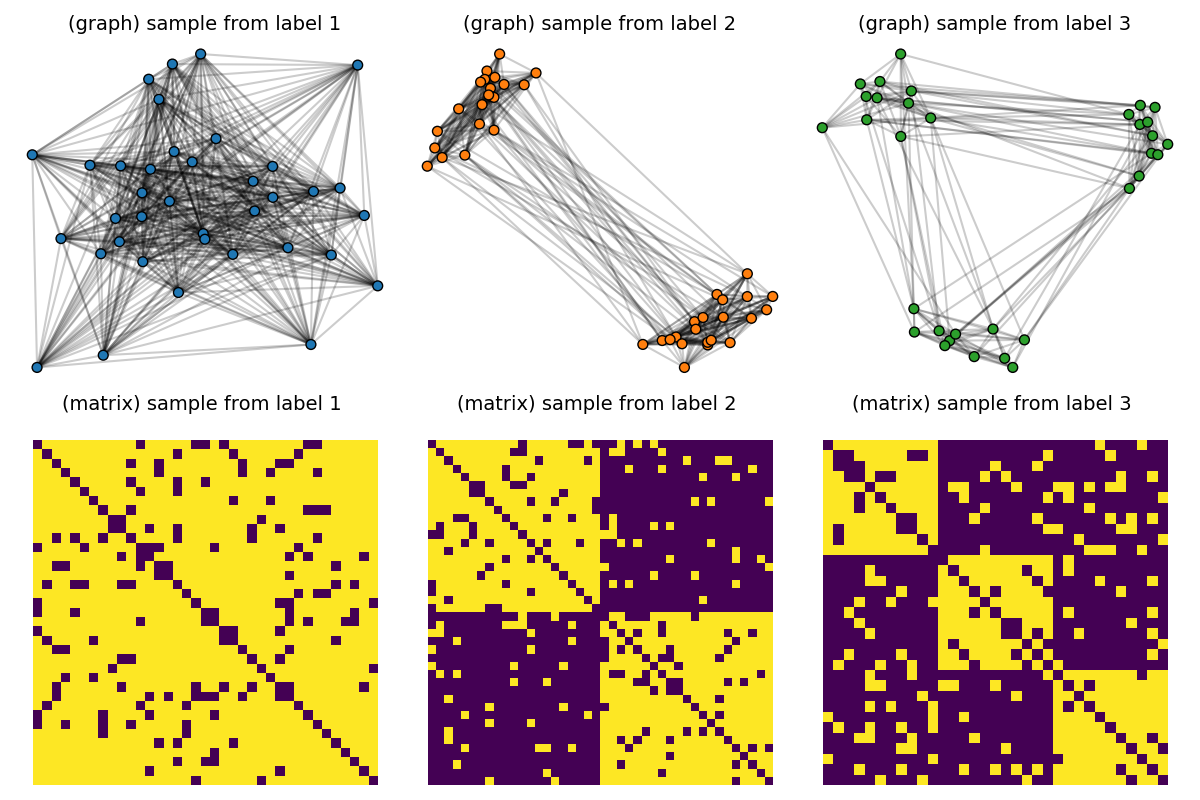
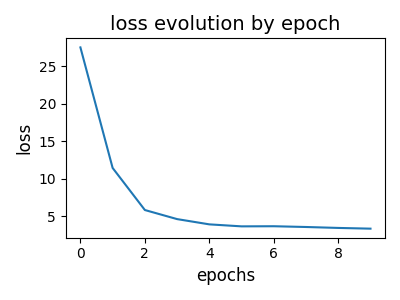
First, we consider a dataset composed of graphs generated by Stochastic Block models with variable sizes taken in \(\{30, ... , 50\}\) and quantities of clusters varying in \(\{ 1, 2, 3\}\). We learn a dictionary of 3 atoms, by minimizing the Gromov-Wasserstein distance from all samples to its model in the dictionary with respect to the dictionary atoms.
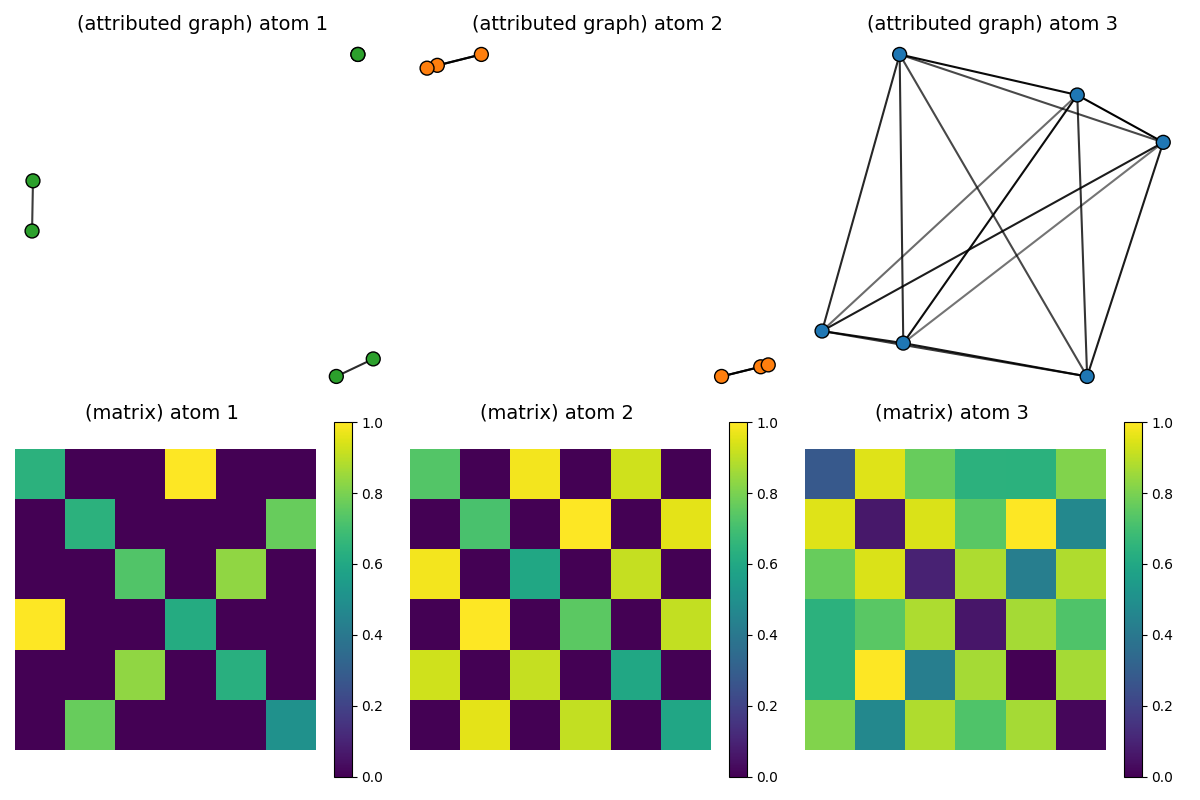
Second, we illustrate the extension of this dictionary learning framework to structured data endowed with node features by using the Fused Gromov-Wasserstein distance. Starting from the aforementioned dataset of unattributed graphs, we add discrete labels uniformly depending on the number of clusters. Then we learn and visualize attributed graph atoms where each sample is modeled as a joint convex combination between atom structures and features.
[38] C. Vincent-Cuaz, T. Vayer, R. Flamary, M. Corneli, N. Courty, Online Graph Dictionary Learning, International Conference on Machine Learning (ICML), 2021.
# Author: Cédric Vincent-Cuaz <cedric.vincent-cuaz@inria.fr>
#
# License: MIT License

# sphinx_gallery_thumbnail_number = 4

import numpy as np
import matplotlib.pylab as pl
from sklearn.manifold import MDS
from ot.gromov import (
    gromov_wasserstein_linear_unmixing,
    gromov_wasserstein_dictionary_learning,
    fused_gromov_wasserstein_linear_unmixing,
    fused_gromov_wasserstein_dictionary_learning,
)
import ot
import networkx
from networkx.generators.community import stochastic_block_model as sbm
Generate a dataset composed of graphs following Stochastic Block models of 1, 2 and 3 clusters.
np.random.seed(42)

N = 60  # number of graphs in the dataset
# For every number of clusters, we generate SBM with fixed inter/intra-clusters probability.
clusters = [1, 2, 3]
Nc = N // len(clusters)  # number of graphs by cluster
nlabels = len(clusters)
dataset = []
labels = []

p_inter = 0.1
p_intra = 0.9
for n_cluster in clusters:
    for i in range(Nc):
        n_nodes = int(np.random.uniform(low=30, high=50))

        if n_cluster > 1:
            P = p_inter * np.ones((n_cluster, n_cluster))
            np.fill_diagonal(P, p_intra)
        else:
            P = p_intra * np.eye(1)
        sizes = np.round(n_nodes * np.ones(n_cluster) / n_cluster).astype(np.int32)
        G = sbm(sizes, P, seed=i, directed=False)
        C = networkx.to_numpy_array(G)
        dataset.append(C)
        labels.append(n_cluster)


# Visualize samples


def plot_graph(x, C, binary=True, color="C0", s=None):
    for j in range(C.shape[0]):
        for i in range(j):
            if binary:
                if C[i, j] > 0:
                    pl.plot(
                        [x[i, 0], x[j, 0]], [x[i, 1], x[j, 1]], alpha=0.2, color="k"
                    )
            else:  # connection intensity proportional to C[i,j]
                pl.plot(
                    [x[i, 0], x[j, 0]], [x[i, 1], x[j, 1]], alpha=C[i, j], color="k"
                )

    pl.scatter(
        x[:, 0], x[:, 1], c=color, s=s, zorder=10, edgecolors="k", cmap="tab10", vmax=9
    )


pl.figure(1, (12, 8))
pl.clf()
for idx_c, c in enumerate(clusters):
    C = dataset[(c - 1) * Nc]  # sample with c clusters
    # get 2d position for nodes
    x = MDS(dissimilarity="precomputed", random_state=0).fit_transform(1 - C)
    pl.subplot(2, nlabels, c)
    pl.title("(graph) sample from label " + str(c), fontsize=14)
    plot_graph(x, C, binary=True, color="C0", s=50.0)
    pl.axis("off")
    pl.subplot(2, nlabels, nlabels + c)
    pl.title("(matrix) sample from label %s \n" % c, fontsize=14)
    pl.imshow(C, interpolation="nearest")
    pl.axis("off")
pl.tight_layout()
pl.show()
/home/circleci/.local/lib/python3.12/site-packages/sklearn/manifold/_mds.py:735: FutureWarning: The default value of `init` will change from 'random' to 'classical_mds' in 1.10. To suppress this warning, provide some value of `init`.
  warnings.warn(
/home/circleci/.local/lib/python3.12/site-packages/sklearn/manifold/_mds.py:752: FutureWarning: The `dissimilarity` parameter is deprecated and will be removed in 1.10. Use `metric` instead.
  warnings.warn(
/home/circleci/project/examples/gromov/plot_gromov_wasserstein_dictionary_learning.py:106: UserWarning: No data for colormapping provided via 'c'. Parameters 'cmap', 'vmax' will be ignored
  pl.scatter(
Estimate the Gromov-Wasserstein dictionary from the dataset
np.random.seed(0)
ps = [ot.unif(C.shape[0]) for C in dataset]

D = 3  # 3 atoms in the dictionary
nt = 6  # of 6 nodes each

q = ot.unif(nt)
reg = 0.0  # regularization coefficient to promote sparsity of unmixings {w_s}

Cdict_GW, log = gromov_wasserstein_dictionary_learning(
    Cs=dataset,
    D=D,
    nt=nt,
    ps=ps,
    q=q,
    epochs=10,
    batch_size=16,
    learning_rate=0.1,
    reg=reg,
    projection="nonnegative_symmetric",
    tol_outer=10 ** (-5),
    tol_inner=10 ** (-5),
    max_iter_outer=30,
    max_iter_inner=300,
    use_log=True,
    use_adam_optimizer=True,
    verbose=True,
)
# visualize loss evolution over epochs
pl.figure(2, (4, 3))
pl.clf()
pl.title("loss evolution by epoch", fontsize=14)
pl.plot(log["loss_epochs"])
pl.xlabel("epochs", fontsize=12)
pl.ylabel("loss", fontsize=12)
pl.tight_layout()
pl.show()
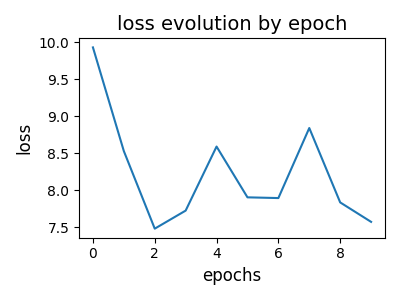
--- epoch = 0  cumulated reconstruction error:  10.152447116509183
--- epoch = 1  cumulated reconstruction error:  8.376648244548251
--- epoch = 2  cumulated reconstruction error:  7.582653135034555
--- epoch = 3  cumulated reconstruction error:  7.191317009487834
--- epoch = 4  cumulated reconstruction error:  6.771243693738413
--- epoch = 5  cumulated reconstruction error:  6.463033914852691
--- epoch = 6  cumulated reconstruction error:  6.524922966730298
--- epoch = 7  cumulated reconstruction error:  6.528036767104814
--- epoch = 8  cumulated reconstruction error:  6.435335008919362
--- epoch = 9  cumulated reconstruction error:  6.315911276026065
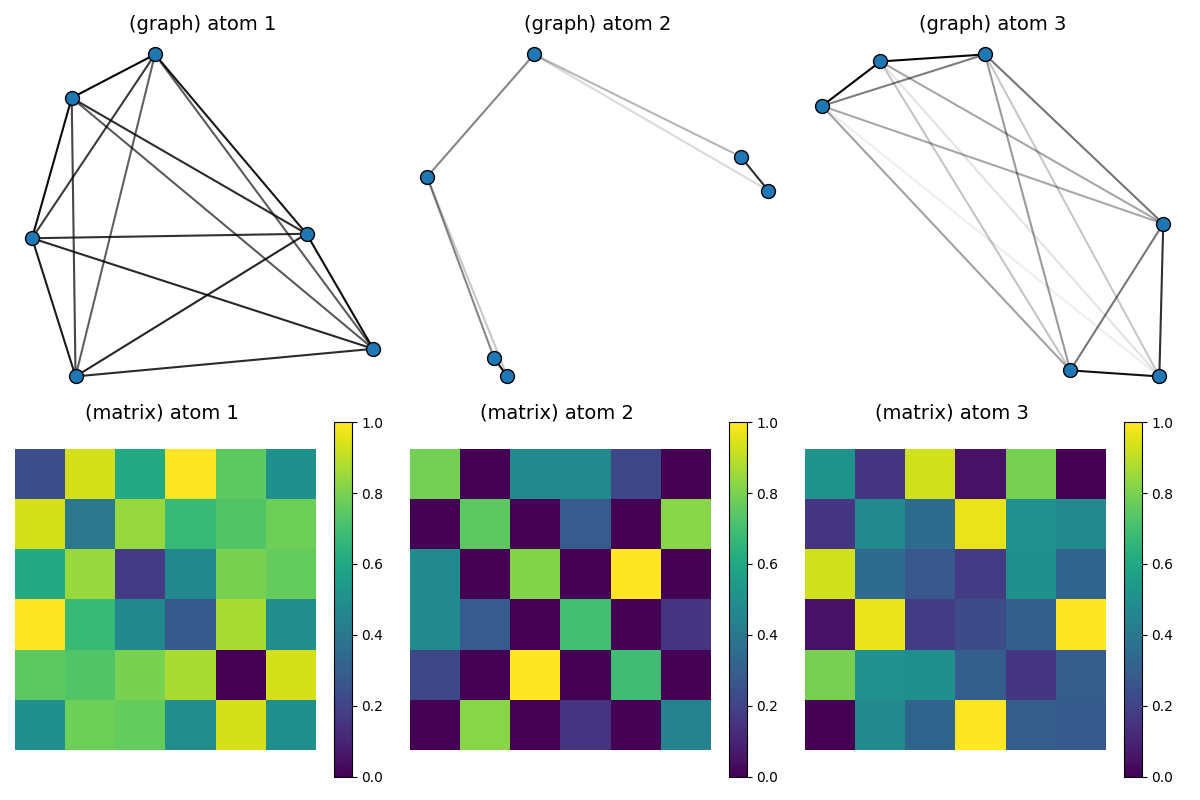
Visualization of the estimated dictionary atoms
# Continuous connections between nodes of the atoms are colored in shades of grey (1: dark / 2: white)

pl.figure(3, (12, 8))
pl.clf()
for idx_atom, atom in enumerate(Cdict_GW):
    scaled_atom = (atom - atom.min()) / (atom.max() - atom.min())
    x = MDS(dissimilarity="precomputed", random_state=0).fit_transform(1 - scaled_atom)
    pl.subplot(2, D, idx_atom + 1)
    pl.title("(graph) atom " + str(idx_atom + 1), fontsize=14)
    plot_graph(x, atom / atom.max(), binary=False, color="C0", s=100.0)
    pl.axis("off")
    pl.subplot(2, D, D + idx_atom + 1)
    pl.title("(matrix) atom %s \n" % (idx_atom + 1), fontsize=14)
    pl.imshow(scaled_atom, interpolation="nearest")
    pl.colorbar()
    pl.axis("off")
pl.tight_layout()
pl.show()
/home/circleci/.local/lib/python3.12/site-packages/sklearn/manifold/_mds.py:735: FutureWarning: The default value of `init` will change from 'random' to 'classical_mds' in 1.10. To suppress this warning, provide some value of `init`.
  warnings.warn(
/home/circleci/.local/lib/python3.12/site-packages/sklearn/manifold/_mds.py:752: FutureWarning: The `dissimilarity` parameter is deprecated and will be removed in 1.10. Use `metric` instead.
  warnings.warn(
/home/circleci/project/examples/gromov/plot_gromov_wasserstein_dictionary_learning.py:106: UserWarning: No data for colormapping provided via 'c'. Parameters 'cmap', 'vmax' will be ignored
  pl.scatter(
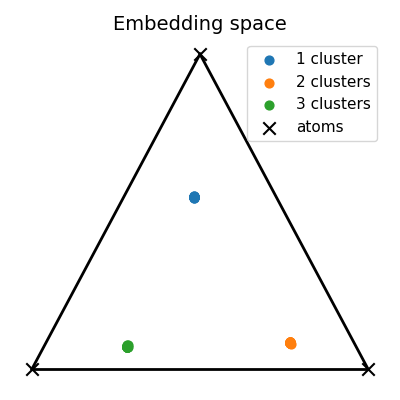
Visualization of the embedding space
unmixings = []
reconstruction_errors = []
for C in dataset:
    p = ot.unif(C.shape[0])
    unmixing, Cembedded, OT, reconstruction_error = gromov_wasserstein_linear_unmixing(
        C,
        Cdict_GW,
        p=p,
        q=q,
        reg=reg,
        tol_outer=10 ** (-5),
        tol_inner=10 ** (-5),
        max_iter_outer=30,
        max_iter_inner=300,
    )
    unmixings.append(unmixing)
    reconstruction_errors.append(reconstruction_error)
unmixings = np.array(unmixings)
print("cumulated reconstruction error:", np.array(reconstruction_errors).sum())


# Compute the 2D representation of the unmixing living in the 2-simplex of probability
unmixings2D = np.zeros(shape=(N, 2))
for i, w in enumerate(unmixings):
    unmixings2D[i, 0] = (2.0 * w[1] + w[2]) / 2.0
    unmixings2D[i, 1] = (np.sqrt(3.0) * w[2]) / 2.0
x = [0.0, 0.0]
y = [1.0, 0.0]
z = [0.5, np.sqrt(3) / 2.0]
extremities = np.stack([x, y, z])

pl.figure(4, (4, 4))
pl.clf()
pl.title("Embedding space", fontsize=14)
for cluster in range(nlabels):
    start, end = Nc * cluster, Nc * (cluster + 1)
    if cluster == 0:
        pl.scatter(
            unmixings2D[start:end, 0],
            unmixings2D[start:end, 1],
            c="C" + str(cluster),
            marker="o",
            s=40.0,
            label="1 cluster",
        )
    else:
        pl.scatter(
            unmixings2D[start:end, 0],
            unmixings2D[start:end, 1],
            c="C" + str(cluster),
            marker="o",
            s=40.0,
            label="%s clusters" % (cluster + 1),
        )
pl.scatter(
    extremities[:, 0], extremities[:, 1], c="black", marker="x", s=80.0, label="atoms"
)
pl.plot([x[0], y[0]], [x[1], y[1]], color="black", linewidth=2.0)
pl.plot([x[0], z[0]], [x[1], z[1]], color="black", linewidth=2.0)
pl.plot([y[0], z[0]], [y[1], z[1]], color="black", linewidth=2.0)
pl.axis("off")
pl.legend(fontsize=11)
pl.tight_layout()
pl.show()
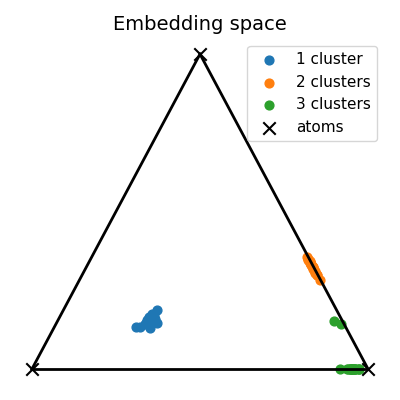
cumulated reconstruction error: 5.995079412909317
Endow the dataset with node features
We follow this feature assignment on all nodes of a graph depending on its label/number of clusters 1 cluster –> 0 as nodes feature 2 clusters –> 1 as nodes feature 3 clusters –> 2 as nodes feature features are one-hot encoded following these assignments
dataset_features = []
for i in range(len(dataset)):
    n = dataset[i].shape[0]
    F = np.zeros((n, 3))
    if i < Nc:  # graph with 1 cluster
        F[:, 0] = 1.0
    elif i < 2 * Nc:  # graph with 2 clusters
        F[:, 1] = 1.0
    else:  # graph with 3 clusters
        F[:, 2] = 1.0
    dataset_features.append(F)

pl.figure(5, (12, 8))
pl.clf()
for idx_c, c in enumerate(clusters):
    C = dataset[(c - 1) * Nc]  # sample with c clusters
    F = dataset_features[(c - 1) * Nc]
    colors = ["C" + str(np.argmax(F[i])) for i in range(F.shape[0])]
    # get 2d position for nodes
    x = MDS(dissimilarity="precomputed", random_state=0).fit_transform(1 - C)
    pl.subplot(2, nlabels, c)
    pl.title("(graph) sample from label " + str(c), fontsize=14)
    plot_graph(x, C, binary=True, color=colors, s=50)
    pl.axis("off")
    pl.subplot(2, nlabels, nlabels + c)
    pl.title("(matrix) sample from label %s \n" % c, fontsize=14)
    pl.imshow(C, interpolation="nearest")
    pl.axis("off")
pl.tight_layout()
pl.show()
/home/circleci/.local/lib/python3.12/site-packages/sklearn/manifold/_mds.py:735: FutureWarning: The default value of `init` will change from 'random' to 'classical_mds' in 1.10. To suppress this warning, provide some value of `init`.
  warnings.warn(
/home/circleci/.local/lib/python3.12/site-packages/sklearn/manifold/_mds.py:752: FutureWarning: The `dissimilarity` parameter is deprecated and will be removed in 1.10. Use `metric` instead.
  warnings.warn(
/home/circleci/project/examples/gromov/plot_gromov_wasserstein_dictionary_learning.py:106: UserWarning: No data for colormapping provided via 'c'. Parameters 'cmap', 'vmax' will be ignored
  pl.scatter(
/home/circleci/.local/lib/python3.12/site-packages/sklearn/manifold/_mds.py:735: FutureWarning: The default value of `init` will change from 'random' to 'classical_mds' in 1.10. To suppress this warning, provide some value of `init`.
  warnings.warn(
/home/circleci/.local/lib/python3.12/site-packages/sklearn/manifold/_mds.py:752: FutureWarning: The `dissimilarity` parameter is deprecated and will be removed in 1.10. Use `metric` instead.
  warnings.warn(
/home/circleci/project/examples/gromov/plot_gromov_wasserstein_dictionary_learning.py:106: UserWarning: No data for colormapping provided via 'c'. Parameters 'cmap', 'vmax' will be ignored
  pl.scatter(
/home/circleci/.local/lib/python3.12/site-packages/sklearn/manifold/_mds.py:735: FutureWarning: The default value of `init` will change from 'random' to 'classical_mds' in 1.10. To suppress this warning, provide some value of `init`.
  warnings.warn(
/home/circleci/.local/lib/python3.12/site-packages/sklearn/manifold/_mds.py:752: FutureWarning: The `dissimilarity` parameter is deprecated and will be removed in 1.10. Use `metric` instead.
  warnings.warn(
/home/circleci/project/examples/gromov/plot_gromov_wasserstein_dictionary_learning.py:106: UserWarning: No data for colormapping provided via 'c'. Parameters 'cmap', 'vmax' will be ignored
  pl.scatter(
Estimate a Fused Gromov-Wasserstein dictionary from the dataset of attributed graphs
np.random.seed(0)
ps = [ot.unif(C.shape[0]) for C in dataset]
D = 3  # 6 atoms instead of 3
nt = 6
q = ot.unif(nt)
reg = 0.001
alpha = 0.5  # trade-off parameter between structure and feature information of Fused Gromov-Wasserstein


Cdict_FGW, Ydict_FGW, log = fused_gromov_wasserstein_dictionary_learning(
    Cs=dataset,
    Ys=dataset_features,
    D=D,
    nt=nt,
    ps=ps,
    q=q,
    alpha=alpha,
    epochs=10,
    batch_size=16,
    learning_rate_C=0.1,
    learning_rate_Y=0.1,
    reg=reg,
    tol_outer=10 ** (-5),
    tol_inner=10 ** (-5),
    max_iter_outer=30,
    max_iter_inner=300,
    projection="nonnegative_symmetric",
    use_log=True,
    use_adam_optimizer=True,
    verbose=True,
)
# visualize loss evolution
pl.figure(6, (4, 3))
pl.clf()
pl.title("loss evolution by epoch", fontsize=14)
pl.plot(log["loss_epochs"])
pl.xlabel("epochs", fontsize=12)
pl.ylabel("loss", fontsize=12)
pl.tight_layout()
pl.show()
--- epoch:  0  cumulated reconstruction error:  27.48001590826663
--- epoch:  1  cumulated reconstruction error:  11.373678745537424
--- epoch:  2  cumulated reconstruction error:  5.650034902928677
--- epoch:  3  cumulated reconstruction error:  4.51357749635168
--- epoch:  4  cumulated reconstruction error:  3.877766425196455
--- epoch:  5  cumulated reconstruction error:  3.6175600423665535
--- epoch:  6  cumulated reconstruction error:  3.6144023290196117
--- epoch:  7  cumulated reconstruction error:  3.5162021290951397
--- epoch:  8  cumulated reconstruction error:  3.4241757231127465
--- epoch:  9  cumulated reconstruction error:  3.3076410347667817
Visualization of the estimated dictionary atoms
pl.figure(7, (12, 8))
pl.clf()
max_features = Ydict_FGW.max()
min_features = Ydict_FGW.min()

for idx_atom, (Catom, Fatom) in enumerate(zip(Cdict_FGW, Ydict_FGW)):
    scaled_atom = (Catom - Catom.min()) / (Catom.max() - Catom.min())
    # scaled_F = 2 * (Fatom - min_features) / (max_features - min_features)
    colors = ["C%s" % np.argmax(Fatom[i]) for i in range(Fatom.shape[0])]
    x = MDS(dissimilarity="precomputed", random_state=0).fit_transform(1 - scaled_atom)
    pl.subplot(2, D, idx_atom + 1)
    pl.title("(attributed graph) atom " + str(idx_atom + 1), fontsize=14)
    plot_graph(x, Catom / Catom.max(), binary=False, color=colors, s=100)
    pl.axis("off")
    pl.subplot(2, D, D + idx_atom + 1)
    pl.title("(matrix) atom %s \n" % (idx_atom + 1), fontsize=14)
    pl.imshow(scaled_atom, interpolation="nearest")
    pl.colorbar()
    pl.axis("off")
pl.tight_layout()
pl.show()
/home/circleci/.local/lib/python3.12/site-packages/sklearn/manifold/_mds.py:735: FutureWarning: The default value of `init` will change from 'random' to 'classical_mds' in 1.10. To suppress this warning, provide some value of `init`.
  warnings.warn(
/home/circleci/.local/lib/python3.12/site-packages/sklearn/manifold/_mds.py:752: FutureWarning: The `dissimilarity` parameter is deprecated and will be removed in 1.10. Use `metric` instead.
  warnings.warn(
/home/circleci/project/examples/gromov/plot_gromov_wasserstein_dictionary_learning.py:106: UserWarning: No data for colormapping provided via 'c'. Parameters 'cmap', 'vmax' will be ignored
  pl.scatter(
/home/circleci/.local/lib/python3.12/site-packages/sklearn/manifold/_mds.py:735: FutureWarning: The default value of `init` will change from 'random' to 'classical_mds' in 1.10. To suppress this warning, provide some value of `init`.
  warnings.warn(
/home/circleci/.local/lib/python3.12/site-packages/sklearn/manifold/_mds.py:752: FutureWarning: The `dissimilarity` parameter is deprecated and will be removed in 1.10. Use `metric` instead.
  warnings.warn(
/home/circleci/project/examples/gromov/plot_gromov_wasserstein_dictionary_learning.py:106: UserWarning: No data for colormapping provided via 'c'. Parameters 'cmap', 'vmax' will be ignored
  pl.scatter(
/home/circleci/.local/lib/python3.12/site-packages/sklearn/manifold/_mds.py:735: FutureWarning: The default value of `init` will change from 'random' to 'classical_mds' in 1.10. To suppress this warning, provide some value of `init`.
  warnings.warn(
/home/circleci/.local/lib/python3.12/site-packages/sklearn/manifold/_mds.py:752: FutureWarning: The `dissimilarity` parameter is deprecated and will be removed in 1.10. Use `metric` instead.
  warnings.warn(
/home/circleci/project/examples/gromov/plot_gromov_wasserstein_dictionary_learning.py:106: UserWarning: No data for colormapping provided via 'c'. Parameters 'cmap', 'vmax' will be ignored
  pl.scatter(
Visualization of the embedding space
unmixings = []
reconstruction_errors = []
for i in range(len(dataset)):
    C = dataset[i]
    Y = dataset_features[i]
    p = ot.unif(C.shape[0])
    unmixing, Cembedded, Yembedded, OT, reconstruction_error = (
        fused_gromov_wasserstein_linear_unmixing(
            C,
            Y,
            Cdict_FGW,
            Ydict_FGW,
            p=p,
            q=q,
            alpha=alpha,
            reg=reg,
            tol_outer=10 ** (-6),
            tol_inner=10 ** (-6),
            max_iter_outer=30,
            max_iter_inner=300,
        )
    )
    unmixings.append(unmixing)
    reconstruction_errors.append(reconstruction_error)
unmixings = np.array(unmixings)
print("cumulated reconstruction error:", np.array(reconstruction_errors).sum())

# Visualize unmixings in the 2-simplex of probability
unmixings2D = np.zeros(shape=(N, 2))
for i, w in enumerate(unmixings):
    unmixings2D[i, 0] = (2.0 * w[1] + w[2]) / 2.0
    unmixings2D[i, 1] = (np.sqrt(3.0) * w[2]) / 2.0
x = [0.0, 0.0]
y = [1.0, 0.0]
z = [0.5, np.sqrt(3) / 2.0]
extremities = np.stack([x, y, z])

pl.figure(8, (4, 4))
pl.clf()
pl.title("Embedding space", fontsize=14)
for cluster in range(nlabels):
    start, end = Nc * cluster, Nc * (cluster + 1)
    if cluster == 0:
        pl.scatter(
            unmixings2D[start:end, 0],
            unmixings2D[start:end, 1],
            c="C" + str(cluster),
            marker="o",
            s=40.0,
            label="1 cluster",
        )
    else:
        pl.scatter(
            unmixings2D[start:end, 0],
            unmixings2D[start:end, 1],
            c="C" + str(cluster),
            marker="o",
            s=40.0,
            label="%s clusters" % (cluster + 1),
        )

pl.scatter(
    extremities[:, 0], extremities[:, 1], c="black", marker="x", s=80.0, label="atoms"
)
pl.plot([x[0], y[0]], [x[1], y[1]], color="black", linewidth=2.0)
pl.plot([x[0], z[0]], [x[1], z[1]], color="black", linewidth=2.0)
pl.plot([y[0], z[0]], [y[1], z[1]], color="black", linewidth=2.0)
pl.axis("off")
pl.legend(fontsize=11)
pl.tight_layout()
pl.show()
cumulated reconstruction error: 3.1238227728750476
Total running time of the script: (0 minutes 19.283 seconds)