Note
Go to the end to download the full example code.
Generalized Wasserstein Barycenter Demo
Note
Example added in release: 0.9.1.
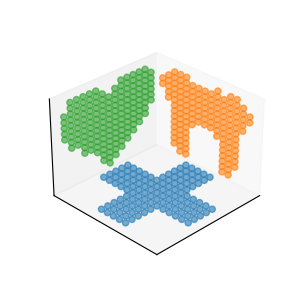
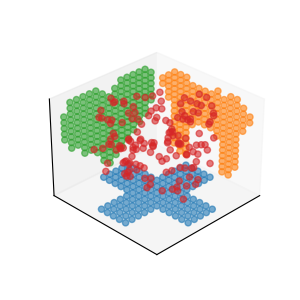
This example illustrates the computation of Generalized Wasserstein Barycenter as proposed in [42].
[42] Delon, J., Gozlan, N., and Saint-Dizier, A.. Generalized Wasserstein barycenters between probability measures living on different subspaces. arXiv preprint arXiv:2105.09755, 2021.
# Author: Eloi Tanguy <eloi.tanguy@math.cnrs.fr>
#
# License: MIT License
# sphinx_gallery_thumbnail_number = 2
import numpy as np
import matplotlib.pyplot as plt
import matplotlib.pylab as pl
import ot
import matplotlib.animation as animation
Generate and plot data
# Input measures
sub_sample_factor = 8
I1 = pl.imread("../../data/redcross.png").astype(np.float64)[
::sub_sample_factor, ::sub_sample_factor, 2
]
I2 = pl.imread("../../data/tooth.png").astype(np.float64)[
::-sub_sample_factor, ::sub_sample_factor, 2
]
I3 = pl.imread("../../data/heart.png").astype(np.float64)[
::-sub_sample_factor, ::sub_sample_factor, 2
]
sz = I1.shape[0]
UU, VV = np.meshgrid(np.arange(sz), np.arange(sz))
# Input measure locations in their respective 2D spaces
X_list = [np.stack((UU[im == 0], VV[im == 0]), 1) * 1.0 for im in [I1, I2, I3]]
# Input measure weights
a_list = [ot.unif(x.shape[0]) for x in X_list]
# Projections 3D -> 2D
P1 = np.array([[1, 0, 0], [0, 1, 0]])
P2 = np.array([[0, 1, 0], [0, 0, 1]])
P3 = np.array([[1, 0, 0], [0, 0, 1]])
P_list = [P1, P2, P3]
# Barycenter weights
weights = np.array([1 / 3, 1 / 3, 1 / 3])
# Number of barycenter points to compute
n_samples_bary = 150
# Send the input measures into 3D space for visualization
X_visu = [Xi @ Pi for (Xi, Pi) in zip(X_list, P_list)]
# Plot the input data
fig = plt.figure(figsize=(3, 3))
axis = fig.add_subplot(1, 1, 1, projection="3d")
for Xi in X_visu:
axis.scatter(Xi[:, 0], Xi[:, 1], Xi[:, 2], marker="o", alpha=0.6)
axis.view_init(azim=45)
axis.set_xticks([])
axis.set_yticks([])
axis.set_zticks([])
plt.show()

Barycenter computation and plot
Y = ot.lp.generalized_free_support_barycenter(X_list, a_list, P_list, n_samples_bary)
fig = plt.figure(figsize=(3, 3))
axis = fig.add_subplot(1, 1, 1, projection="3d")
for Xi in X_visu:
axis.scatter(Xi[:, 0], Xi[:, 1], Xi[:, 2], marker="o", alpha=0.6)
axis.scatter(Y[:, 0], Y[:, 1], Y[:, 2], marker="o", alpha=0.6)
axis.view_init(azim=45)
axis.set_xticks([])
axis.set_yticks([])
axis.set_zticks([])
plt.show()

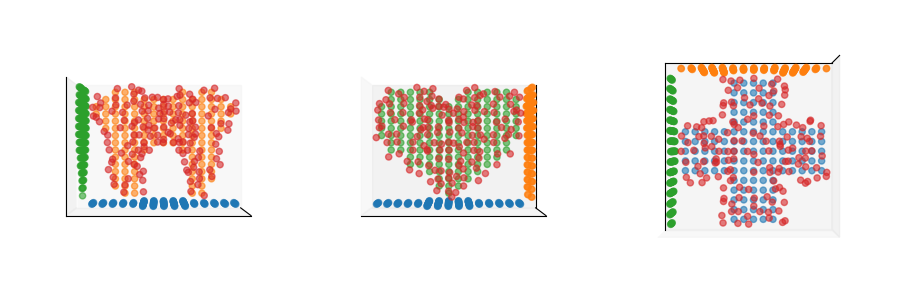
Plotting projection matches
fig = plt.figure(figsize=(9, 3))
ax = fig.add_subplot(1, 3, 1, projection="3d")
for Xi in X_visu:
ax.scatter(Xi[:, 0], Xi[:, 1], Xi[:, 2], marker="o", alpha=0.6)
ax.scatter(Y[:, 0], Y[:, 1], Y[:, 2], marker="o", alpha=0.6)
ax.view_init(elev=0, azim=0)
ax.set_xticks([])
ax.set_yticks([])
ax.set_zticks([])
ax = fig.add_subplot(1, 3, 2, projection="3d")
for Xi in X_visu:
ax.scatter(Xi[:, 0], Xi[:, 1], Xi[:, 2], marker="o", alpha=0.6)
ax.scatter(Y[:, 0], Y[:, 1], Y[:, 2], marker="o", alpha=0.6)
ax.view_init(elev=0, azim=90)
ax.set_xticks([])
ax.set_yticks([])
ax.set_zticks([])
ax = fig.add_subplot(1, 3, 3, projection="3d")
for Xi in X_visu:
ax.scatter(Xi[:, 0], Xi[:, 1], Xi[:, 2], marker="o", alpha=0.6)
ax.scatter(Y[:, 0], Y[:, 1], Y[:, 2], marker="o", alpha=0.6)
ax.view_init(elev=90, azim=0)
ax.set_xticks([])
ax.set_yticks([])
ax.set_zticks([])
plt.tight_layout()
plt.show()

Rotation animation
fig = plt.figure(figsize=(7, 7))
ax = fig.add_subplot(1, 1, 1, projection="3d")
def _init():
for Xi in X_visu:
ax.scatter(Xi[:, 0], Xi[:, 1], Xi[:, 2], marker="o", alpha=0.6)
ax.scatter(Y[:, 0], Y[:, 1], Y[:, 2], marker="o", alpha=0.6)
ax.view_init(elev=0, azim=0)
ax.set_xticks([])
ax.set_yticks([])
ax.set_zticks([])
return (fig,)
def _update_plot(i):
if i < 45:
ax.view_init(elev=0, azim=4 * i)
else:
ax.view_init(elev=i - 45, azim=4 * i)
return (fig,)
ani = animation.FuncAnimation(
fig,
_update_plot,
init_func=_init,
frames=136,
interval=50,
blit=True,
repeat_delay=2000,
)