Note
Go to the end to download the full example code.
Semi-relaxed (Fused) Gromov-Wasserstein Barycenter as Dictionary Learning
Note
Example added in release: 0.9.5.
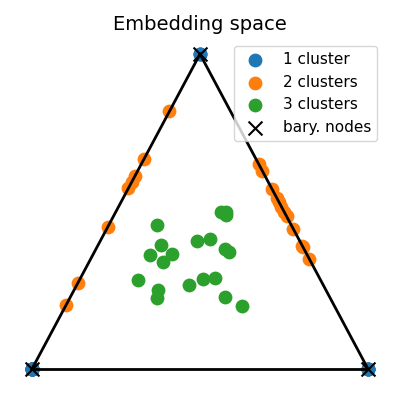
In this example, we illustrate how to learn a semi-relaxed Gromov-Wasserstein (srGW) barycenter using a Block-Coordinate Descent algorithm, on a dataset of structured data such as graphs, denoted \(\{ \mathbf{C_s} \}_{s \in [S]}\) where every nodes have uniform weights \(\{ \mathbf{p_s} \}_{s \in [S]}\). Given a barycenter structure matrix \(\mathbf{C}\) with N nodes, each graph \((\mathbf{C_s}, \mathbf{p_s})\) is modeled as a reweighed subgraph with structure \(\mathbf{C}\) and weights \(\mathbf{w_s} \in \Sigma_N\) where each \(\mathbf{w_s}\) corresponds to the second marginal of the OT \(\mathbf{T_s}\) (s.t \(\mathbf{w_s} = \mathbf{T_s}^\top \mathbf{1}\)) minimizing the srGW loss between the s^{th} input and the barycenter.
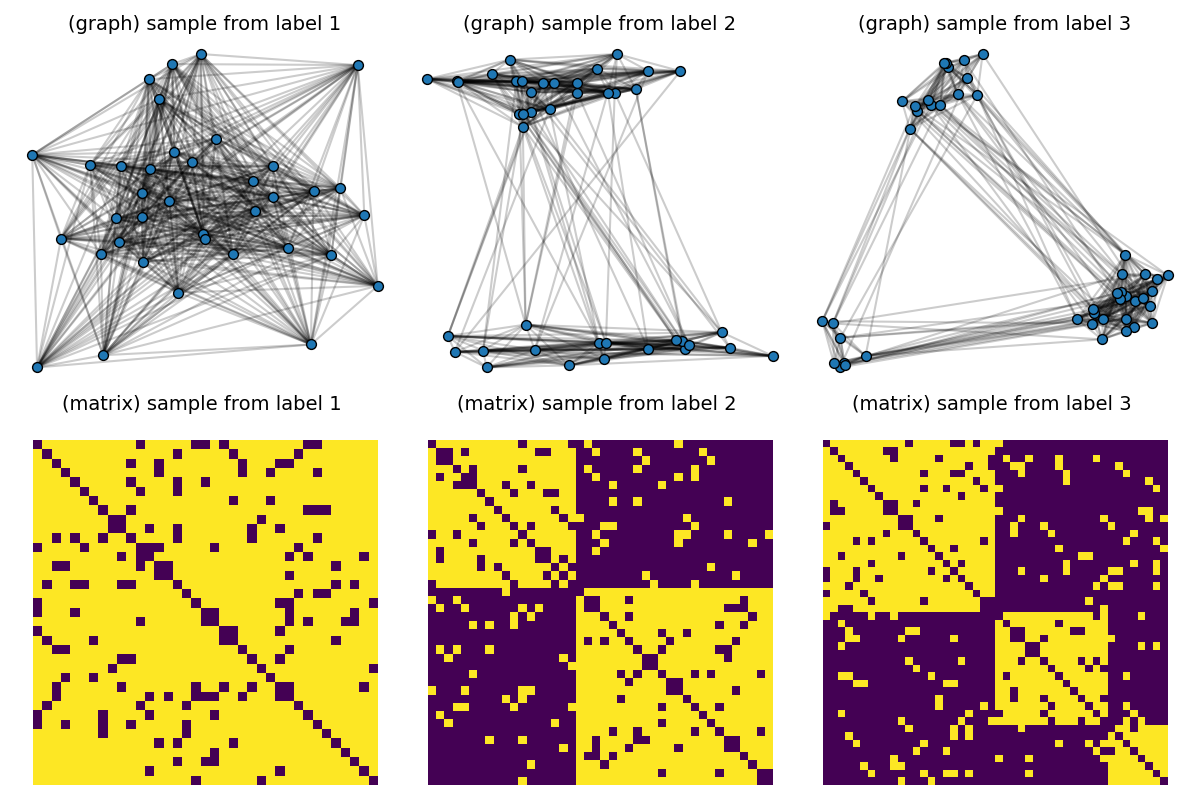
First, we consider a dataset composed of graphs generated by Stochastic Block models with variable sizes taken in \(\{30, ... , 50\}\) and number of clusters varying in \(\{ 1, 2, 3\}\) with random proportions. We learn a srGW barycenter with 3 nodes and visualize the learned structure and the embeddings for some inputs.
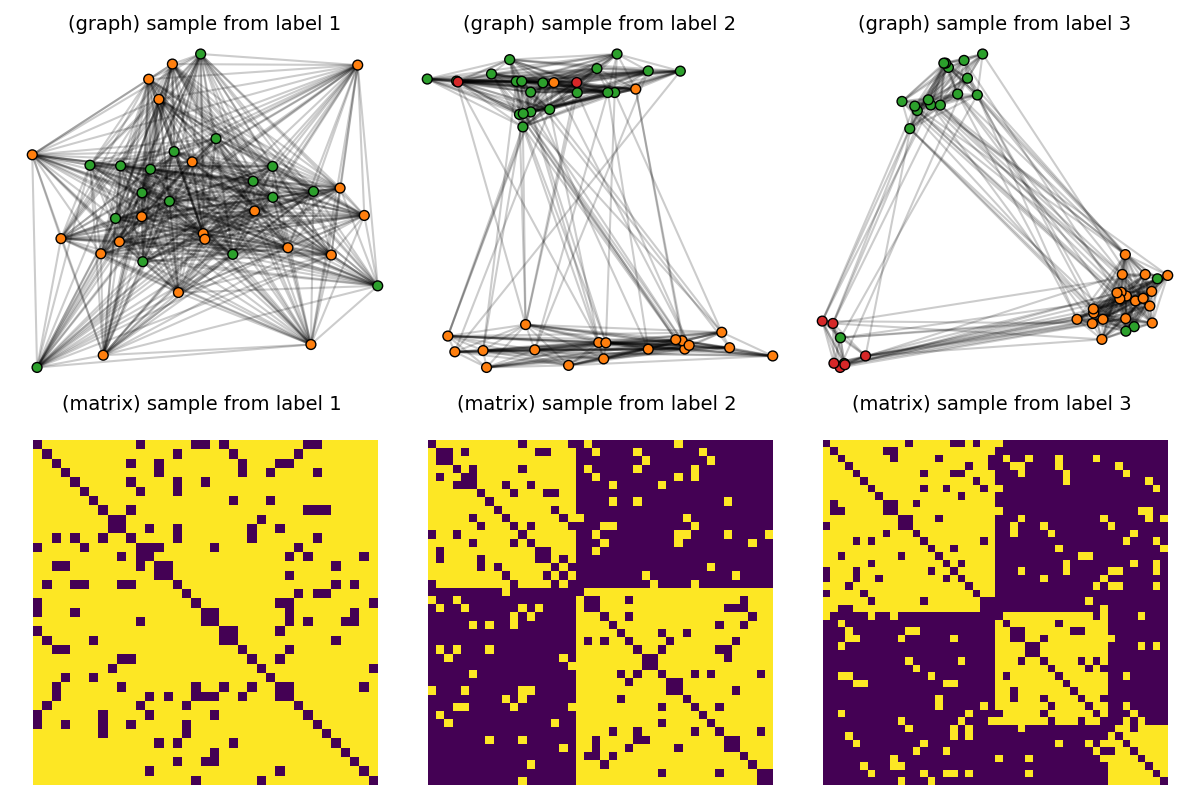
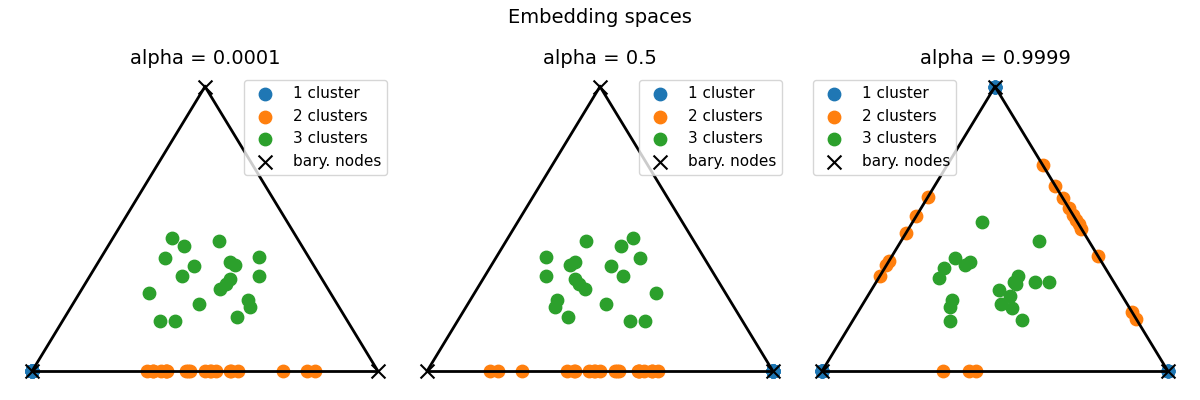
Second, we illustrate the extension of this framework to graphs endowed with node features by using the semi-relaxed Fused Gromov-Wasserstein divergence (srFGW). Starting from the aforementioned dataset of unattributed graphs, we add discrete labels uniformly depending on the number of clusters. Then conduct the analog analysis.
[48] Cédric Vincent-Cuaz, Rémi Flamary, Marco Corneli, Titouan Vayer, Nicolas Courty. “Semi-relaxed Gromov-Wasserstein divergence and applications on graphs”. International Conference on Learning Representations (ICLR), 2022.
# Author: Cédric Vincent-Cuaz <cedric.vincent-cuaz@inria.fr>
#
# License: MIT License

# sphinx_gallery_thumbnail_number = 2

import numpy as np
import matplotlib.pylab as pl
from sklearn.manifold import MDS
from ot.gromov import semirelaxed_gromov_barycenters, semirelaxed_fgw_barycenters
import ot
import networkx
from networkx.generators.community import stochastic_block_model as sbm
Generate a dataset composed of graphs following Stochastic Block models of 1, 2 and 3 clusters.
np.random.seed(42)

n_samples = 60  # number of graphs in the dataset
# For every number of clusters, we generate SBM with fixed inter/intra-clusters probability,
# and variable cluster proportions.
clusters = [1, 2, 3]
Nc = n_samples // len(clusters)  # number of graphs by cluster
nlabels = len(clusters)
dataset = []
node_labels = []
labels = []

p_inter = 0.1
p_intra = 0.9
for n_cluster in clusters:
    for i in range(Nc):
        n_nodes = int(np.random.uniform(low=30, high=50))

        if n_cluster > 1:
            P = p_inter * np.ones((n_cluster, n_cluster))
            np.fill_diagonal(P, p_intra)
            props = np.random.uniform(0.2, 1, size=(n_cluster,))
            props /= props.sum()
            sizes = np.round(n_nodes * props).astype(np.int32)
        else:
            P = p_intra * np.eye(1)
            sizes = [n_nodes]

        G = sbm(sizes, P, seed=i, directed=False)
        part = np.array([G.nodes[i]["block"] for i in range(np.sum(sizes))])
        C = networkx.to_numpy_array(G)
        dataset.append(C)
        node_labels.append(part)
        labels.append(n_cluster)


# Visualize samples


def plot_graph(x, C, binary=True, color="C0", s=None):
    for j in range(C.shape[0]):
        for i in range(j):
            if binary:
                if C[i, j] > 0:
                    pl.plot(
                        [x[i, 0], x[j, 0]], [x[i, 1], x[j, 1]], alpha=0.2, color="k"
                    )
            else:  # connection intensity proportional to C[i,j]
                pl.plot(
                    [x[i, 0], x[j, 0]], [x[i, 1], x[j, 1]], alpha=C[i, j], color="k"
                )

    pl.scatter(
        x[:, 0], x[:, 1], c=color, s=s, zorder=10, edgecolors="k", cmap="tab10", vmax=9
    )


pl.figure(1, (12, 8))
pl.clf()
for idx_c, c in enumerate(clusters):
    C = dataset[(c - 1) * Nc]  # sample with c clusters
    # get 2d position for nodes
    x = MDS(dissimilarity="precomputed", random_state=0).fit_transform(1 - C)
    pl.subplot(2, nlabels, c)
    pl.title("(graph) sample from label " + str(c), fontsize=14)
    plot_graph(x, C, binary=True, color="C0", s=50.0)
    pl.axis("off")
    pl.subplot(2, nlabels, nlabels + c)
    pl.title("(matrix) sample from label %s \n" % c, fontsize=14)
    pl.imshow(C, interpolation="nearest")
    pl.axis("off")
pl.tight_layout()
pl.show()

/home/circleci/.local/lib/python3.10/site-packages/sklearn/manifold/_mds.py:677: FutureWarning: The default value of `n_init` will change from 4 to 1 in 1.9.
warnings.warn(
/home/circleci/project/examples/gromov/plot_semirelaxed_gromov_wasserstein_barycenter.py:111: UserWarning: No data for colormapping provided via 'c'. Parameters 'cmap', 'vmax' will be ignored
pl.scatter(
Estimate the srGW barycenter from the dataset and visualize embeddings
np.random.seed(0)
ps = [ot.unif(C.shape[0]) for C in dataset] # uniform weights on input nodes
lambdas = [1.0 / n_samples for _ in range(n_samples)] # uniform barycenter
N = 3 # 3 nodes in the barycenter
# Here we use the Fluid partitioning method to deduce initial transport plans
# for the barycenter problem. An initlal structure is also deduced from these
# initial transport plans. Then a warmstart strategy is used iteratively to
# init each individual srGW problem within the BCD algorithm.
init_plan = "fluid" # notice that several init options are implemented in `ot.gromov.semirelaxed_init_plan`
warmstartT = True
C, log = semirelaxed_gromov_barycenters(
N=N,
Cs=dataset,
ps=ps,
lambdas=lambdas,
loss_fun="square_loss",
tol=1e-6,
stop_criterion="loss",
warmstartT=warmstartT,
log=True,
G0=init_plan,
verbose=False,
)
print("barycenter structure:", C)
unmixings = log["p"]
# Compute the 2D representation of the embeddings living in the 2-simplex of probability
unmixings2D = np.zeros(shape=(n_samples, 2))
for i, w in enumerate(unmixings):
unmixings2D[i, 0] = (2.0 * w[1] + w[2]) / 2.0
unmixings2D[i, 1] = (np.sqrt(3.0) * w[2]) / 2.0
x = [0.0, 0.0]
y = [1.0, 0.0]
z = [0.5, np.sqrt(3) / 2.0]
extremities = np.stack([x, y, z])
pl.figure(2, (4, 4))
pl.clf()
pl.title("Embedding space", fontsize=14)
for cluster in range(nlabels):
start, end = Nc * cluster, Nc * (cluster + 1)
if cluster == 0:
pl.scatter(
unmixings2D[start:end, 0],
unmixings2D[start:end, 1],
c="C" + str(cluster),
marker="o",
s=80.0,
label="1 cluster",
)
else:
pl.scatter(
unmixings2D[start:end, 0],
unmixings2D[start:end, 1],
c="C" + str(cluster),
marker="o",
s=80.0,
label="%s clusters" % (cluster + 1),
)
pl.scatter(
extremities[:, 0],
extremities[:, 1],
c="black",
marker="x",
s=100.0,
label="bary. nodes",
)
pl.plot([x[0], y[0]], [x[1], y[1]], color="black", linewidth=2.0)
pl.plot([x[0], z[0]], [x[1], z[1]], color="black", linewidth=2.0)
pl.plot([y[0], z[0]], [y[1], z[1]], color="black", linewidth=2.0)
pl.axis("off")
pl.legend(fontsize=11)
pl.tight_layout()
pl.show()

barycenter structure: [[0.85475039 0.09817066 0.09700949]
[0.09817066 0.86179306 0.0950269 ]
[0.09700949 0.0950269 0.85271831]]
Endow the dataset with node features
node labels, corresponding to the true SBM cluster assignments, are set for each graph as one-hot encoded node features.
dataset_features = []
for i in range(len(dataset)):
n = dataset[i].shape[0]
F = np.zeros((n, 3))
F[np.arange(n), node_labels[i]] = 1.0
dataset_features.append(F)
pl.figure(3, (12, 8))
pl.clf()
for idx_c, c in enumerate(clusters):
C = dataset[(c - 1) * Nc] # sample with c clusters
F = dataset_features[(c - 1) * Nc]
colors = [f"C{labels[i]}" for i in range(F.shape[0])]
# get 2d position for nodes
x = MDS(dissimilarity="precomputed", random_state=0).fit_transform(1 - C)
pl.subplot(2, nlabels, c)
pl.title("(graph) sample from label " + str(c), fontsize=14)
plot_graph(x, C, binary=True, color=colors, s=50)
pl.axis("off")
pl.subplot(2, nlabels, nlabels + c)
pl.title("(matrix) sample from label %s \n" % c, fontsize=14)
pl.imshow(C, interpolation="nearest")
pl.axis("off")
pl.tight_layout()
pl.show()

/home/circleci/.local/lib/python3.10/site-packages/sklearn/manifold/_mds.py:677: FutureWarning: The default value of `n_init` will change from 4 to 1 in 1.9.
  warnings.warn(
/home/circleci/project/examples/gromov/plot_semirelaxed_gromov_wasserstein_barycenter.py:111: UserWarning: No data for colormapping provided via 'c'. Parameters 'cmap', 'vmax' will be ignored
  pl.scatter(
/home/circleci/.local/lib/python3.10/site-packages/sklearn/manifold/_mds.py:677: FutureWarning: The default value of `n_init` will change from 4 to 1 in 1.9.
  warnings.warn(
/home/circleci/project/examples/gromov/plot_semirelaxed_gromov_wasserstein_barycenter.py:111: UserWarning: No data for colormapping provided via 'c'. Parameters 'cmap', 'vmax' will be ignored
  pl.scatter(
/home/circleci/.local/lib/python3.10/site-packages/sklearn/manifold/_mds.py:677: FutureWarning: The default value of `n_init` will change from 4 to 1 in 1.9.
  warnings.warn(
/home/circleci/project/examples/gromov/plot_semirelaxed_gromov_wasserstein_barycenter.py:111: UserWarning: No data for colormapping provided via 'c'. Parameters 'cmap', 'vmax' will be ignored
  pl.scatter(
Estimate the srFGW barycenter from the attributed graphs and visualize embeddings
We emphasize the dependence to the trade-off parameter alpha that weights the relative importance between structures (alpha=1) and features (alpha=0), knowing that embeddings that perfectly cluster graphs w.r.t their features should ease the identification of the number of clusters in the graphs.
list_alphas = [0.0001, 0.5, 0.9999]
list_unmixings2D = []

for ialpha, alpha in enumerate(list_alphas):
    print("--- alpha:", alpha)
    C, F, log = semirelaxed_fgw_barycenters(
        N=N,
        Ys=dataset_features,
        Cs=dataset,
        ps=ps,
        lambdas=lambdas,
        alpha=alpha,
        loss_fun="square_loss",
        tol=1e-6,
        stop_criterion="loss",
        warmstartT=warmstartT,
        log=True,
        G0=init_plan,
    )

    print("barycenter structure:", C)
    print("barycenter features:", F)

    unmixings = log["p"]
    # Compute the 2D representation of the embeddings living in the 2-simplex of probability
    unmixings2D = np.zeros(shape=(n_samples, 2))
    for i, w in enumerate(unmixings):
        unmixings2D[i, 0] = (2.0 * w[1] + w[2]) / 2.0
        unmixings2D[i, 1] = (np.sqrt(3.0) * w[2]) / 2.0
    list_unmixings2D.append(unmixings2D.copy())

x = [0.0, 0.0]
y = [1.0, 0.0]
z = [0.5, np.sqrt(3) / 2.0]
extremities = np.stack([x, y, z])

pl.figure(4, (12, 4))
pl.clf()
pl.suptitle("Embedding spaces", fontsize=14)
for ialpha, alpha in enumerate(list_alphas):
    pl.subplot(1, len(list_alphas), ialpha + 1)
    pl.title(f"alpha = {alpha}", fontsize=14)
    for cluster in range(nlabels):
        start, end = Nc * cluster, Nc * (cluster + 1)
        if cluster == 0:
            pl.scatter(
                list_unmixings2D[ialpha][start:end, 0],
                list_unmixings2D[ialpha][start:end, 1],
                c="C" + str(cluster),
                marker="o",
                s=80.0,
                label="1 cluster",
            )
        else:
            pl.scatter(
                list_unmixings2D[ialpha][start:end, 0],
                list_unmixings2D[ialpha][start:end, 1],
                c="C" + str(cluster),
                marker="o",
                s=80.0,
                label="%s clusters" % (cluster + 1),
            )
    pl.scatter(
        extremities[:, 0],
        extremities[:, 1],
        c="black",
        marker="x",
        s=100.0,
        label="bary. nodes",
    )
    pl.plot([x[0], y[0]], [x[1], y[1]], color="black", linewidth=2.0)
    pl.plot([x[0], z[0]], [x[1], z[1]], color="black", linewidth=2.0)
    pl.plot([y[0], z[0]], [y[1], z[1]], color="black", linewidth=2.0)
    pl.axis("off")
    pl.legend(fontsize=11)
pl.tight_layout()
pl.show()

--- alpha: 0.0001
barycenter structure: [[1. 0. 0.]
 [0. 1. 0.]
 [0. 0. 1.]]
barycenter features: [[0.86400199 0.09381731 0.10469915]
 [0.09381731 0.84251959 0.09963309]
 [0.10469915 0.09963309 0.81742118]]
--- alpha: 0.5
barycenter structure: [[0. 1. 0.]
 [1. 0. 0.]
 [0. 0. 1.]]
barycenter features: [[0.84251959 0.09381731 0.09963309]
 [0.09381731 0.86400199 0.10469915]
 [0.09963309 0.10469915 0.81742118]]
--- alpha: 0.9999
barycenter structure: [[0.54552834 0.3750892  0.07938246]
 [0.64651618 0.20052606 0.15295776]
 [0.64252604 0.25622497 0.10124898]]
barycenter features: [[0.85927826 0.0959401  0.10171816]
 [0.0959401  0.8493456  0.0927736 ]
 [0.10171816 0.0927736  0.85829174]]
Total running time of the script: (0 minutes 6.044 seconds)